
You can pass the written exam and still be unprepared for the first landing distance calculation that matters.
That moment usually shows up before a real flight, not during a quiz. You're sitting with a sectional, a weather briefing, and a destination that looked simple until you noticed the runway is shorter, narrower, hotter, or less familiar than KCNO. Suddenly the question isn't “how do I read the chart?” It's “can I land there with margin, and if I can't, what am I going to do instead?”
Beyond the Written Exam Your First Real Calculation
A student planning a first solo cross-country out of Chino often starts with the usual priorities. Weather looks good. Fuel is straightforward. The route is manageable. Then the destination airport brings the first real pause.
At KCNO, you get used to a busy, towered environment and a runway picture that feels generous. That can hide a bad habit. Pilots start assuming that if they can routinely land the airplane well, the runway question will sort itself out. It won't.
The first useful landing distance calculation usually happens when a student compares two airports and realizes one gives them room for a stable arrival and one doesn't. Same airplane. Same pilot. Different temperature, different runway surface, different comfort level. The math changes the plan before the airplane ever moves.
Why this matters on a normal day
Landing performance isn't just for mountain strips, short fields, or ugly weather. It matters on calm, blue-sky days because calm days still involve weight, heat, runway condition, and human variability.
A good calculation does three things:
- It slows your decision-making on the ground. That's where judgment is cheap and mistakes are easy to fix.
- It exposes hidden risk. A runway may be legal on paper and still be a poor choice for your current experience level.
- It gives you alternatives early. You can carry less fuel, pick a different runway, choose another airport, or delay the trip.
Practical rule: If a runway only works when everything goes right, it doesn't work for a student pilot.
At this stage, real training starts to separate itself from test prep. On the written exam, the answer is usually a number. In real flying, the answer is a decision.
The KCNO mindset that helps
Pilots training in Chino already have a good foundation for this. You're operating in a place where planning matters, radio work matters, and traffic flow matters. That environment builds discipline. The next step is applying that same discipline to runway performance.
Think of landing distance calculation as part of the arrival briefing, not as a separate homework problem. Before departure, you want to know:
- What is the book number for this airplane?
- What conditions make that number worse?
- How much runway margin do I want before I call this a comfortable landing?
That last question is the one many new pilots skip. It matters the most.
Decoding Your POH Landing Performance Chart
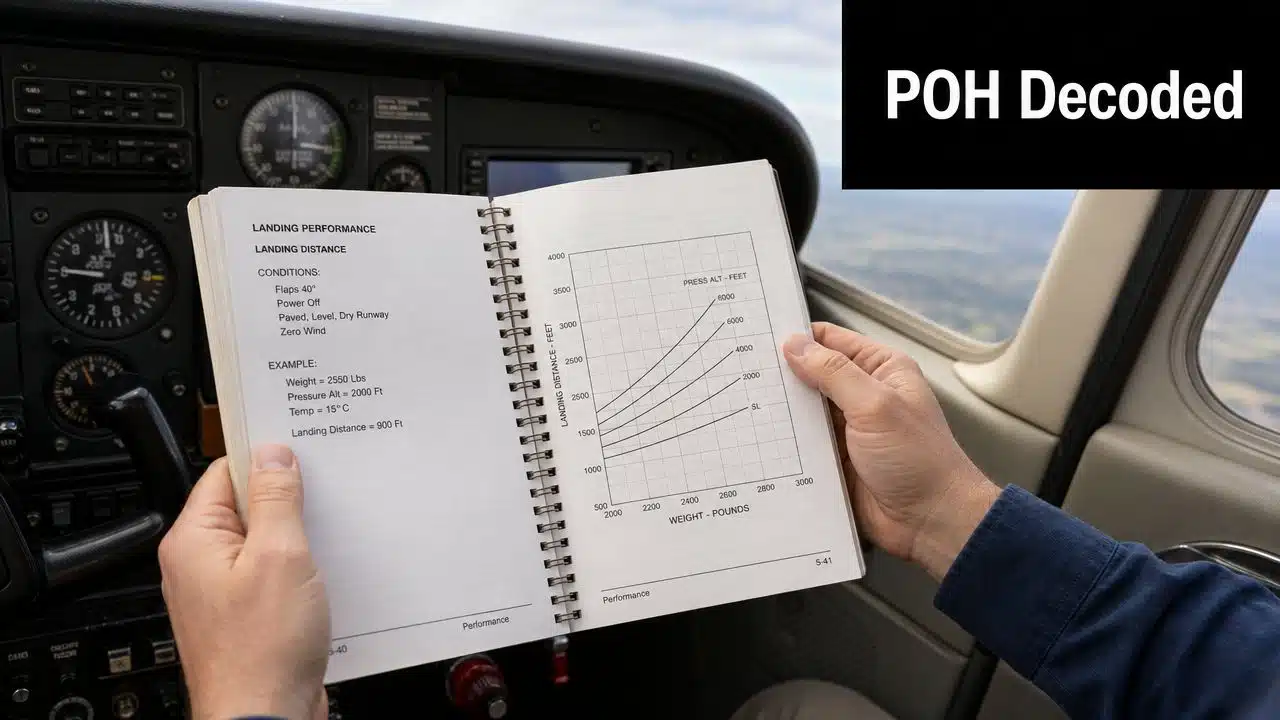
The performance chart in the POH or AFM is where the calculation begins. Not with memory. Not with a guess. Not with what happened on your last lesson.
A practical workflow starts with the aircraft chart, then enters pressure altitude, outside air temperature, and landing weight, before you apply wind, surface, and obstacle corrections. That's the standard chart method taught in training and operations, and it's specifically recommended over using raw runway numbers without published corrections in a step-by-step landing performance workflow.
Start with the exact airplane and exact chart
If you're flying a Cessna 150, use that airplane's POH. If you're flying a Cherokee, use the Cherokee chart. Similar trainers can feel alike in the pattern and still have different chart formats, assumptions, and corrections.
The chart usually asks you to enter with some combination of:
- Pressure altitude
- Outside air temperature
- Landing weight
- Runway surface or wind correction notes
- Obstacle clearance assumptions
The first mistake students make is skipping straight to a familiar-looking number. The second is reading the chart without confirming what the chart assumes. Some charts give ground roll. Some give total distance over an obstacle. Those are not interchangeable.
Read the chart in sequence
With a typical trainer chart, use a deliberate sequence.
- Find the pressure altitude for the destination airport.
- Match it to the outside air temperature.
- Follow the chart to the landing weight line or table.
- Read out the base landing distance.
- Only after that do you apply listed corrections.
If conditions fall between chart lines, interpolate conservatively. Don't round in the direction that flatters the airplane.
A chart is only useful if you respect the assumptions built into it.
What students often miss
Students often want the chart to behave like a single formula. Most POH charts don't. They are structured decision tools. You move through them in order because each variable changes the meaning of the next one.
For a Cessna 150 example, the exact value you pull depends on where pressure altitude and temperature intersect, and whether the chart expects you to account for weight separately or assumes a specific landing configuration. That's why “I know roughly what a 150 needs” isn't enough.
A clean way to avoid mistakes is to write your inputs in the margin or on your kneeboard before touching the chart:
| Item | What to write down |
|---|---|
| Airport condition | Pressure altitude |
| Weather input | Outside air temperature |
| Airplane status | Landing weight |
| Chart output | Base distance from the POH |
That habit saves time because it keeps you from re-reading the chart after every interruption.
Applying Critical Adjustments to Your Base Number
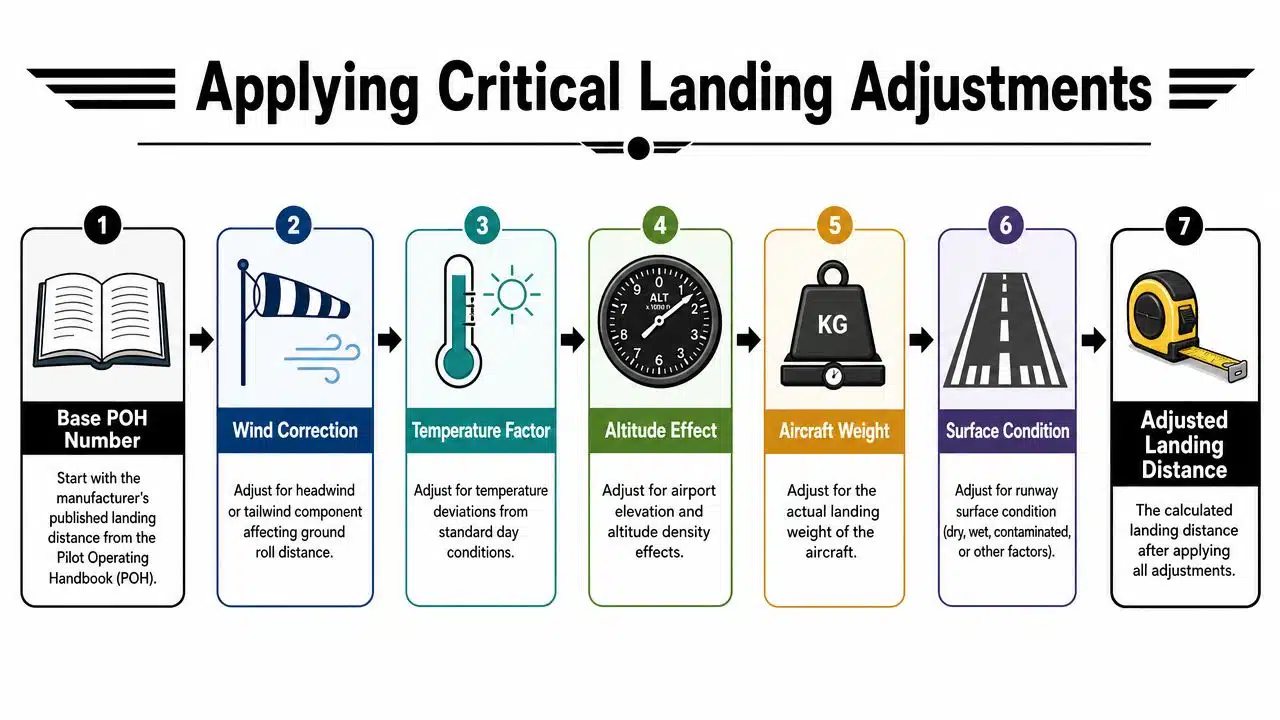
The POH number is the start of the conversation, not the end. Real-world landing distance calculation gets honest when you begin adjusting for what the runway and atmosphere are doing to the airplane.
Weight changes more than pilots expect
Landing distance is highly sensitive to aircraft weight. FAA-linked research notes that landing distance increases approximately with the square of aircraft weight, so a 50% weight increase can raise the required runway length by more than twice that amount, and high temperature or altitude further lengthen the rollout in lower-density air, as discussed in this FAA performance research paper.
That matters even in routine training airplanes. Two people, bags, and extra fuel can move the airplane from “comfortable” to “why is this taking so much runway?” faster than many pilots expect.
If you want a practical reminder of how quickly loading changes performance planning, review a real Cessna 172N weight and balance sheet before your next cross-country. Weight and balance isn't separate from runway performance. It's one of the biggest inputs to it.
Temperature and altitude work together
Hotter air and higher airport elevation both reduce air density. The airplane touches down at a higher true speed for the same indicated speed, and that extra energy has to go somewhere. It goes into rollout distance.
This is why a runway that feels generous in the morning can feel much less generous later in the day. Students often remember density altitude for takeoff and forget that it matters for landing too.
Wind can help, but don't build a plan on perfect wind
A steady headwind reduces groundspeed at touchdown. A tailwind does the opposite. That's basic, but the planning habit matters more than the physics lesson.
Use the correction method published for your airplane. If the POH provides a wind adjustment, use that exact method. If it doesn't, don't make up your own rule and call it precise. Wind is one of the easiest variables to over-trust because ATIS, forecast, and actual touchdown wind don't always match.
A conservative pilot treats headwind as helpful, not guaranteed.
Surface condition changes the whole picture
A dry paved runway is one environment. Wet pavement, grass, gravel, or a runway with poor braking is another. The airplane may still land fine, but the stopping margin can disappear quickly.
Many pilots confuse personal experience with planning reality. “I've stopped shorter than that before” doesn't tell you what today's runway will give you after touchdown.
Slope and obstacles deserve a hard look
Runway slope matters because gravity either helps you slow down or keeps the airplane rolling. Obstacles matter because some charts include total distance from an approach crossing a defined obstacle height to full stop. Others separate that from ground roll.
Before accepting a number, check what you extracted from the chart:
- Ground roll only
- Distance over an obstacle
- Paved runway assumption
- Specified flap and approach configuration
- Braking assumptions in the POH notes
If you don't know whether your number is ground roll or total distance, you don't yet have a usable landing distance calculation.
A practical way to stack corrections
For students, the cleanest process is this short checklist:
- Base number first: Pull the unfudged value from the POH.
- Configuration next: Confirm flap setting, weight, and approach assumptions match your plan.
- Environment after that: Add the published corrections for wind, surface, and any obstacle requirement.
- Final review last: Ask whether the result still feels reasonable for your experience level.
That final question is where airmanship lives. Charts don't make decisions. Pilots do.
Worked Example Landing a Cherokee at Chino KCNO
A useful worked example doesn't need made-up precision. It needs the same decision flow you'd use before a real flight.
Take a Piper Cherokee coming back to Chino on a hot afternoon. The airplane has two people on board, some remaining fuel, and a runway choice that looks routine if you only think in terms of “I've landed here plenty of times.”
Building the scenario the right way
Start where you would typically begin. Open the Cherokee POH and pull the landing performance chart. Determine pressure altitude for KCNO, note the afternoon temperature, and estimate the landing weight based on who is in the airplane and how much fuel remains.
Then look at the wind for your likely runway. At Chino, that might be manageable and favorable, or it might be one more variable to respect rather than count on.
This is also where aircraft choice matters. If you're comparing trainers for capability and comfort, a side-by-side look at Piper Cherokee vs Cessna 172 helps explain why two common training airplanes can lead to different planning habits even on the same route.
Turning chart work into an arrival decision
Once you've got the base number from the POH, apply the chart's published corrections for the day's conditions. If the temperature is high, don't hand-wave it away because you're returning to a familiar home field. High heat affects the result whether you're at a backcountry strip or a towered airport you've flown from all month.
Then pressure-test the answer with practical questions:
- Would I still like this runway if I float?
- What if I touch down a little long?
- What if the wind softens on final?
- Would I be comfortable here after a go-around and second approach?
Those questions are not signs of weak confidence. They're signs that you're thinking like pilot in command.
What the exercise teaches
A worked example at KCNO often surprises students because the conclusion isn't dramatic. The runway may still be perfectly acceptable. The lesson is that you now know why.
That's the difference between habit and judgment. Habit says, “I've done this before.” Judgment says, “I checked the conditions, used the book, and confirmed the margin.”
Good planning doesn't make you timid. It makes you harder to surprise.
That mindset becomes even more useful when the airport is unfamiliar, the runway is shorter, or the conditions are less forgiving than Chino.
From Calculation to Decision Applying Safety Factors
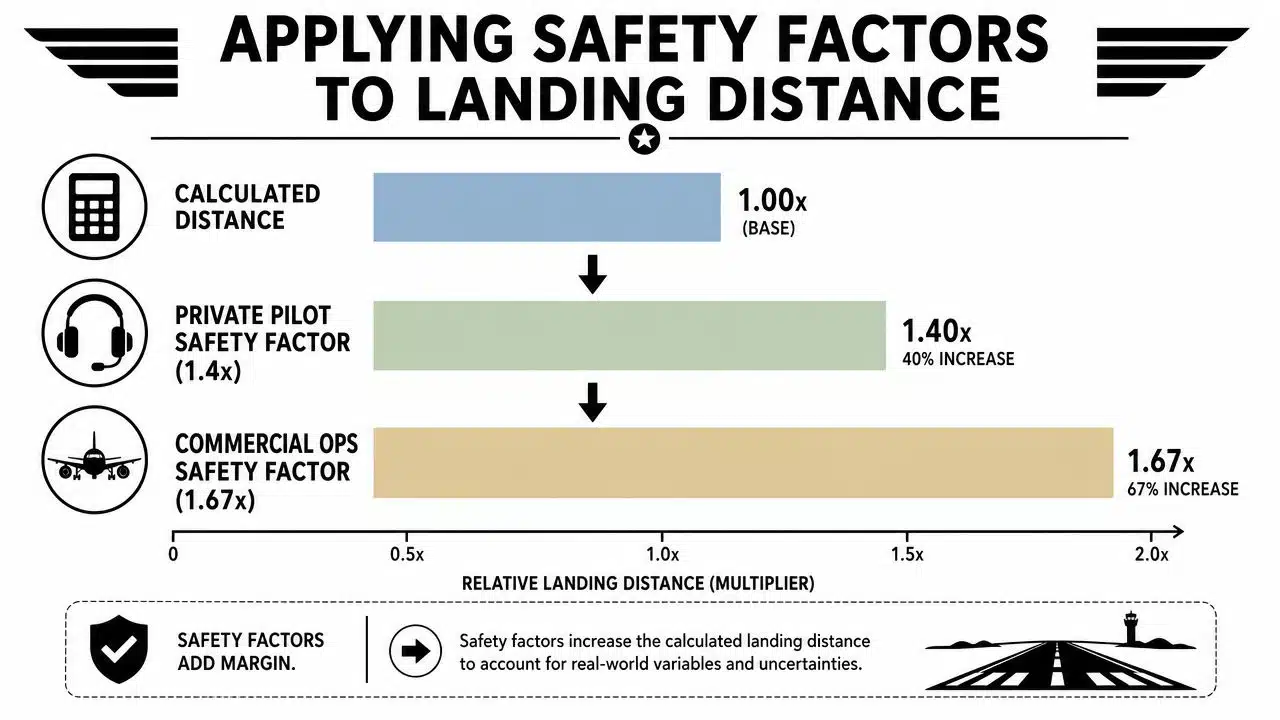
The most common mistake after finishing a landing distance calculation is treating the result as a target. It isn't.
A foundational benchmark in modern landing planning is the FAA/JAA-style safety factor that converts actual landing distance into required runway length by multiplying by 1.67 in dry conditions and 1.92 in wet conditions. The same safety guidance explains that if an AFM landing distance is 3,000 ft, the planning requirement becomes about 5,010 ft dry and about 5,760 ft wet, and some frameworks also apply an extra 15% wet-runway margin, as described in this Flight Safety Foundation landing-distance guidance.
Why the gap exists
Those planning factors exist because certified performance and everyday operations are not the same thing. Certification logic historically measures landing distance from 50 ft above the threshold to a full stop, then expands that result with safety factors for real-world variability such as technique, braking, and runway condition.
In plain English, the industry already knows pilots aren't operating inside a lab.
A simple table for personal planning
You don't need to fly transport-category equipment to learn from transport-category discipline. General aviation pilots can use the same idea to build conservative habits.
| Condition | Recommended Multiplier | Purpose |
|---|---|---|
| Dry runway benchmark | 1.67 | Converts actual landing distance into a more conservative required runway length |
| Wet runway benchmark | 1.92 | Adds a larger planning margin for reduced braking and runway uncertainty |
| Wet planning in some frameworks | 15% additional margin | Adds further operational buffer in certain regulatory approaches |
What works and what doesn't
What works is using the calculated number as the beginning of your go/no-go decision.
What doesn't work is saying, “The chart says I can do it, so I can use all of that runway.” That's backwards. The chart helps you protect margin, not consume it.
For a student or renter pilot, the smart habit is straightforward:
- Choose runways that leave room for an imperfect touchdown.
- Increase your personal margin when the runway is wet or unfamiliar.
- Treat narrow legal margins as a warning sign, not a green light.
A pilot who always needs everything to go right is already behind the airplane.
Why Performance Calculations Matter When Buying an Aircraft
Buying an airplane changes the question from “can I fly this trip?” to “did I buy the right machine for the trips I want to fly?”
A lot of buyers focus on speed, paint, panel, useful load, or monthly cost. Those matter. But performance numbers determine whether the aircraft is practical for your home airport, your favorite weekend destinations, and the weather conditions you fly in.
Mission fit is a safety issue
An airplane can be attractive on paper and still be the wrong purchase if its runway performance pushes you into narrow margins too often. That's especially true for owners who want flexibility. If your preferred airports are smaller, hotter, higher, or occasionally wet, runway performance becomes part of the buying decision, not just part of flight planning.
The safest way to buy is to test each candidate airplane against your real mission:
- Home field reality: How does it fit your normal departure and arrival environment?
- Destination pattern: Are your common airports long and forgiving, or smaller and less flexible?
- Loading habits: Will you usually fly light, or with people, bags, and fuel?
- Seasonal conditions: Does summer heat or higher terrain make the airplane less useful than expected?
Airplanes, helicopters, and honest ownership
Fixed-wing buyers should compare POH performance, loading flexibility, and runway comfort before they fall in love with cosmetic upgrades. A cleaner panel doesn't fix a bad mission match.
Helicopter buyers need the same discipline, just with helicopter-specific performance planning. You aren't looking at landing roll in the same way, but you still need to understand whether the aircraft is appropriate for the places and conditions you intend to operate. Performance charts and limitations deserve the same scrutiny as maintenance records and airframe condition.
A safe purchase starts with a blunt question. Not “Can I afford this aircraft?” Ask “Will this aircraft let me operate conservatively at the places I fly?”
Practical Tips and Quick Reference Tools
Most pilots don't struggle because landing distance calculation is impossible. They struggle because they try to rebuild the entire method from scratch before every trip.
The fix is a repeatable workflow you can carry into the cockpit and use under time pressure.
Build a compact system
Use a kneeboard note, a saved EFB template, or a simple checklist card. Keep the same sequence every time so you don't skip a variable when you're distracted.
A useful quick-reference setup includes:
- Aircraft data: POH chart page and any normal landing assumptions you need to verify
- Airport inputs: Pressure altitude, runway condition, and available landing distance
- Flight inputs: Estimated landing weight and expected wind
- Decision line: Your personal note for what counts as comfortable margin
If you use an iPad in the cockpit, keep your performance workflow organized inside the same system you use for charts and weather. A practical setup guide for pilots using tablets is this overview on an iPad for pilots.
Why your calculated number feels too long
This confuses almost every student at some point. The calculated result often looks much longer than the runway you usually need in day-to-day flying.
That's because the calculation is not trying to predict your average landing. Guidance aimed at this exact confusion points out that the calculated result is a regulatory planning limit, built around a standardized technique and conservative runway assumptions, not your personal landing style, as explained in this discussion of why calculated landing distances look long.
So if you usually touch down neatly and stop well before the midpoint, that doesn't mean the chart is wrong. It means the chart is doing a different job.
The best landings you remember are not a planning standard.
What to carry forward
Keep the process simple enough that you'll use it:
- Pull the book number.
- Adjust for real conditions.
- Add your safety margin.
- Decide whether the runway still gives you comfortable room.
Pilots gain confidence from seeing the same process work again and again. That's much more durable than confidence built on memory or luck.
DuBois Aviation helps pilots build that kind of judgment from the start, whether you're training in airplanes or helicopters, preparing for advanced ratings, or looking for guidance before renting or buying an aircraft. If you want practical instruction based at Chino with experienced CFIs and real-world decision-making built into the process, explore DuBois Aviation.


